Quickstart
Create a new polygon
Today, we are going to calculate a polygon for a sugar cane crop located in Boyaca, Colombia. The input data is a set of points near to the crop and the main goal is to find the mininum polygon which covers all the crop area only using a little number of the given examples and a satellite image. The satellite image is a 3 band raster of a Sentinel 2A scene. The bands we use are: Band 11 (Short Wave Infrared - I), Band 8 (Near Infrared) and Band 2 (Blue). The cell resolution is 10m X 10m per pixel. For band 11 we made a resampling process using a bilinear transformation.
The given points were taken at the sugar cane crop borders. Near to this crop we have other crops like yucca and corn and non crops areas like native forest. The blue area is the sugar cane area, manually delimited, we want to achieve. The pink area is the corn corp, the yellov the yucca crop and the orange area is the native forest. The green points are the points given and the red one is the first
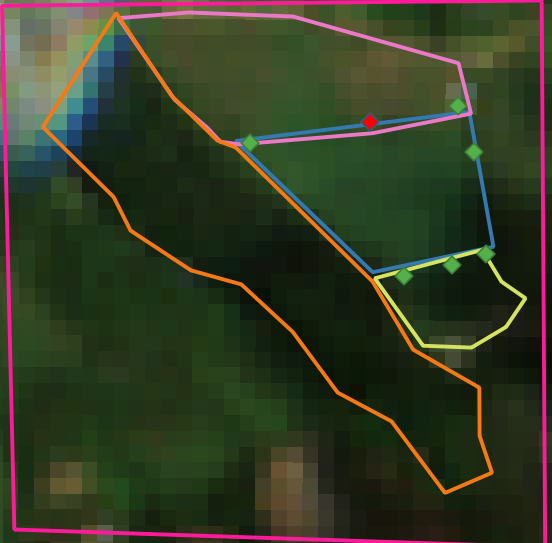
crop area
Now let’s see the points set given
# Libraries
import pandas as pd
import region_grow as rg
The .csv separator MUST be “;” and decimal separator MUST be “,”. If not, the library will fail. Also, the X coordinate column MUST have the title of “LONGITUD” and the Y coordinate the title of “LATITUD”. If you have in mind to use an aproximate area to calculate the polygon, you have to specify this area in the column “HECTAREAS”. The unit of measurement for the area is the hectare (ha)
df = pd.read_csv("crop/crop_points.csv", sep=";", decimal=",")
df.head(3)
| LATITUD | LONGITUD | HECTAREAS | |
|---|---|---|---|
| 0 | 5.804699 | -73.570783 | 1.00051 |
| 1 | 5.804793 | -73.570280 | 1.00051 |
| 2 | 5.804531 | -73.570187 | 1.00051 |
Finally, let’s execute the algorithm to calculate this polygon. In this time, we will use the similarity threshold. This algorithm only use the first given point and expands the region scanning the 8-neighbors of the pixel. The pixel is chosen only if the refrectancy is on the +- range of reflectancy of the given point. When the the aproximately area is given. The algorithm recalculates the polygon minimizing the difference
shape_path = "crop/example.shp"
raster_path = "crop/A_crop.tif"
points_path = "crop/crop_points.csv"
rg.execute_with_area(
    points_path=points_path,
    raster_path=raster_path,
    shape_path=shape_path,
    classifier_tag="BD",
)
WARNING:root:[BandThreshold - Classifier] ATENCION: El conjunto de datos de pixeles semilla tiene mas de 1 registro, solo se utilizara el primero.
Por favor considere ejecutar de nuevo este algoritmo pasando en el .csv unicamente las coordenadas del punto de interes

WARNING:root:[BandThreshold - Classifier] ATENCION: El conjunto de datos de pixeles semilla tiene mas de 1 registro, solo se utilizara el primero.
Por favor considere ejecutar de nuevo este algoritmo pasando en el .csv unicamente las coordenadas del punto de interes
Warning
Above, a warning message has been shown indicating that only the first point of the dataset will be use. The last because the dataset had more than one element. To conclude, let’s see the result polygon
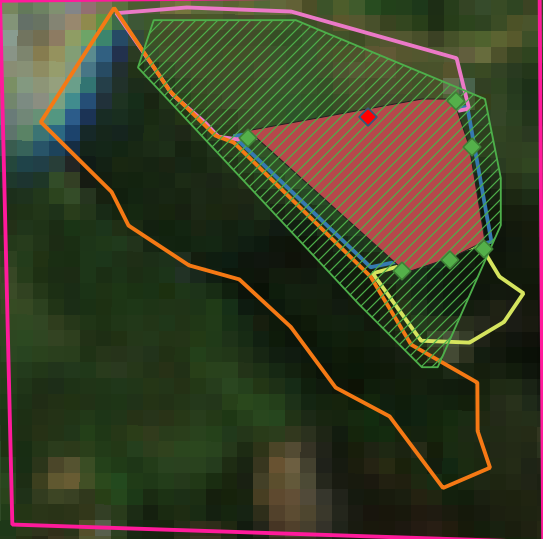
crop area
The red polygon was the generated one, it fills almost all the expected region ! Moreover, the green line polygon was created using spectral indexes EVI, ARVI and GNDVI and it gives an interesting result too, grouping all crops in the scene.
If you want more details about the decisions i made to find the best method to fit new polygons and why i chose this band combination, let me invite you to read my article which will be available in this repository.
Thank you so much for reading and hope this project will be usefull for you
Best regards
Geovanny